Abstract
This package provides a parallel coordinate plot for Optuna studies. It follows Optuna’s visualization module layout: plot_parallel_coordinate returns a Plotly figure, and matplotlib.plot_parallel_coordinate returns a Matplotlib axes object.
The current implementation adds:
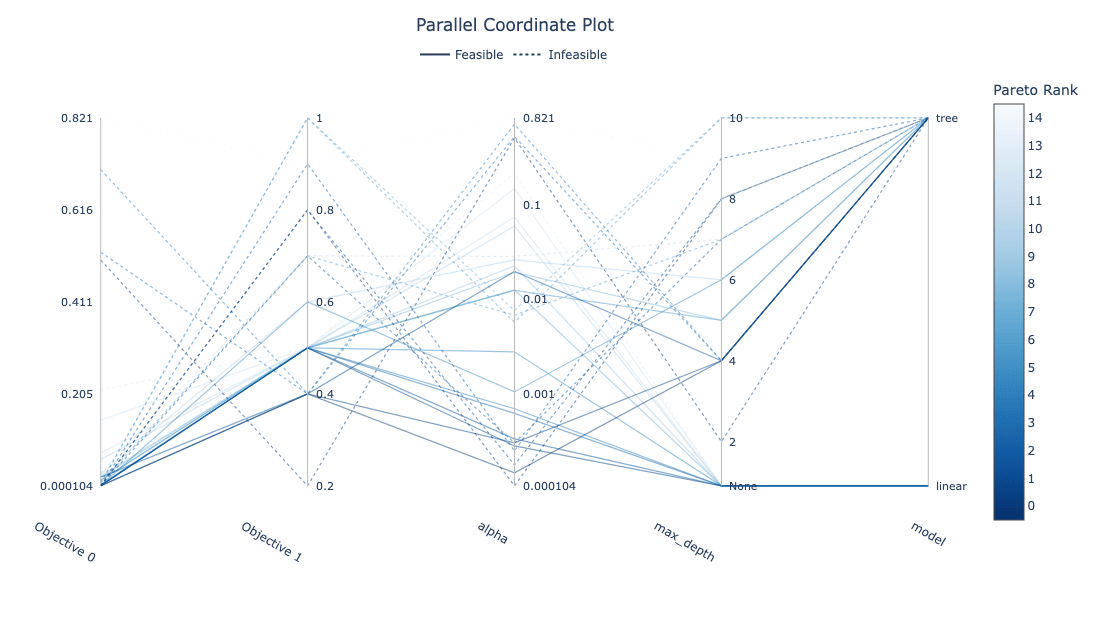
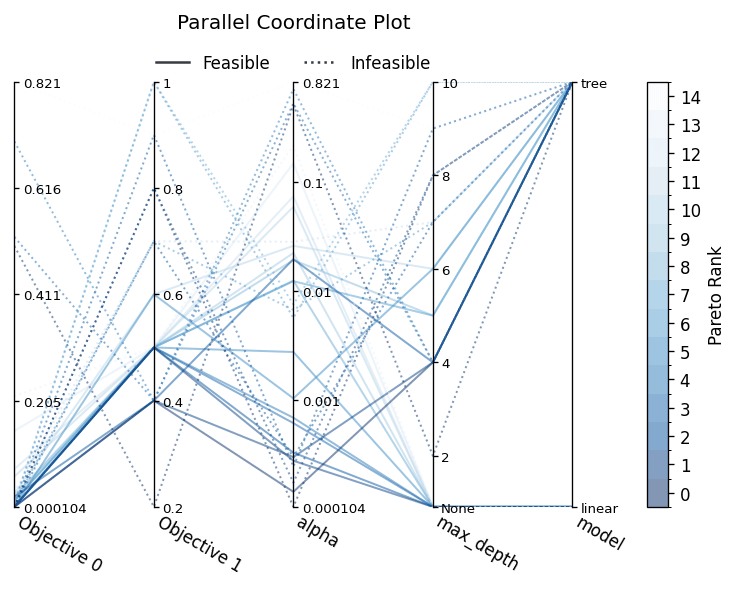
- Conditional parameter support: if a trial does not contain a selected parameter, the line is connected to a special
Nonetick below the valid values. - Multi-objective support: objective axes are shown side by side, and trial colors are ordered by Pareto rank.
- Constrained optimization support: infeasible trials are shown with dotted lines.
For constrained multi-objective studies, Pareto ranks are computed from objective values only. Constraint information is used only to change the line style: feasible trials are shown with solid lines, and infeasible trials are shown with dotted lines. Trials without constraint information are treated as feasible.
APIs
plot_parallel_coordinate(study, params=None, *, target=None, target_name="Objective Value", objective_names=None, missing_label="None")- Returns a
plotly.graph_objects.Figure. study: Anoptuna.Studyobject.params: Optional parameter names to visualize. By default, all parameters observed in completed trials are used.target: Optional target function. If set, this is used as a single target even for multi-objective studies.target_name: Axis and colorbar label for a single target.objective_names: Optional labels for multi-objective axes.missing_label: Label for parameters missing from a trial. The default is"None".
- Returns a
matplotlib.plot_parallel_coordinate(study, params=None, *, target=None, target_name="Objective Value", objective_names=None, missing_label="None")- Returns a
matplotlib.axes.Axes. study: Anoptuna.Studyobject.params: Optional parameter names to visualize. By default, all parameters observed in completed trials are used.target: Optional target function. If set, this is used as a single target even for multi-objective studies.target_name: Axis and colorbar label for a single target.objective_names: Optional labels for multi-objective axes.missing_label: Label for parameters missing from a trial. The default is"None".
- Returns a
Installation
$ pip install plotly matplotlib numpy
Example
import optuna
import optunahub


def objective(trial):
    model = trial.suggest_categorical("model", ["linear", "tree"])
    alpha = trial.suggest_float("alpha", 1e-4, 1.0, log=True)
    if model == "tree":
        max_depth = trial.suggest_int("max_depth", 2, 10)
        return alpha, max_depth / 10
    return alpha, 0.5


def constraints(trial):
    depth = trial.params.get("max_depth", 5) / 10
    return (trial.params["alpha"] + depth - 0.7,)


sampler = optuna.samplers.NSGAIISampler(constraints_func=constraints, seed=0)
study = optuna.create_study(directions=["minimize", "minimize"], sampler=sampler)
study.optimize(objective, n_trials=30)

module = optunahub.load_module(package="visualization/extended_pcp")
fig = module.plot_parallel_coordinate(study)
fig.show()
Matplotlib
import matplotlib.pyplot as plt

ax = module.matplotlib.plot_parallel_coordinate(study)
plt.show()
- Package
- visualization/extended_pcp
- Author
- y0z
- License
- MIT License
- Verified Optuna version
- 4.8.0
- Dependencies (.txt)
- matplotlib
- numpy
- plotly
- Last update
- 2026-07-06
- Discussions & Issues
- Create a discussion
- Create a bug report