Abstract
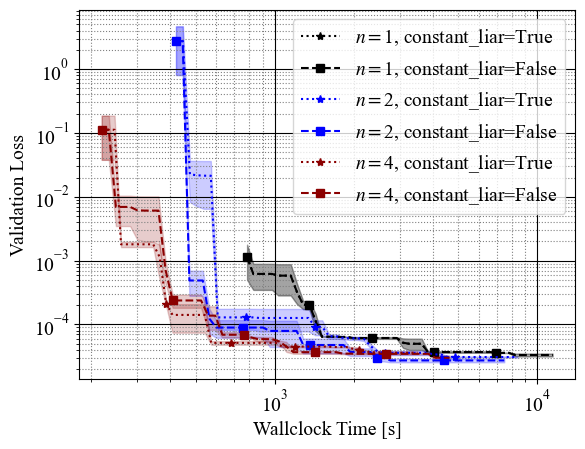
This visualization module enables users to plot the target value over time with standard error bands. This module is especially convenient when we use parallel optimization such as Asynchronous optimization simulation.
Class or Function Names
- plot_target_over_time
Installation
This module requires the following dependencies:
- matplotlib
- numpy
APIs
plot_target_over_time(study_list, *, ax=None, states=None, target=None, target_direction=None, cumtime_func=None, log_time_scale=True, n_steps=100, color=None, **plot_kwargs)study_list: A list ofoptuna.Studyobjects. Each study is treated as one run, and results are averaged across them.ax: Amatplotlib.axes.Axesobject. If not provided, a new figure and axes will be created.states: A list ofoptuna.trial.TrialStateto include. Defaults to[TrialState.COMPLETE, TrialState.PRUNED].target: A callable that takes aFrozenTrialand returns a float value. If not provided,trial.valueis used.target_direction: The direction to optimize the target. Required whentargetis specified. Must be"minimize","maximize", or the correspondingStudyDirectionenum.cumtime_func: A callable that takes aFrozenTrialand returns the cumulative time as a float. If not provided, the elapsed time from the first trial start is used.log_time_scale: Whether to use a logarithmic time scale for interpolation. Defaults toTrue.n_steps: The number of time steps for interpolation. Defaults to100.color: The color for the plot line and shaded region.**plot_kwargs: Additional keyword arguments passed toax.plot(e.g.,label,linestyle).
Example
from __future__ import annotations

import optuna
import optunahub

import matplotlib.pyplot as plt


def objective(trial: optuna.Trial) -> float:
    x = trial.suggest_float("x", -5, 5)
    y = trial.suggest_float("y", -5, 5)
    return x**2 + y**2


plot_target_over_time = optunahub.load_module("visualization/plot_target_over_time").plot_target_over_time
_, ax = plt.subplots()
colors = ["darkred", "black"]
for sampler, color in zip([optuna.samplers.TPESampler(), optuna.samplers.RandomSampler()], colors):
    study_list = []
    for _ in range(5):
        study = optuna.create_study(sampler=sampler)
        study.optimize(objective, n_trials=20)
        study_list.append(study)
    plot_target_over_time(
        study_list,
        ax=ax,
        color=color,
        label=sampler.__class__.__name__,
    )

ax.legend()
plt.show()
- Package
- visualization/plot_target_over_time
- Author
- Shuhei Watanabe
- License
- MIT License
- Verified Optuna version
- 4.8.0
- Last update
- 2026-04-24
- Discussions & Issues
- Create a discussion
- Create a bug report